Example notebook
[1]:
%load_ext autoreload
%autoreload 2
[2]:
import numpy as np
import matplotlib.pyplot as plt

import odhin
odhin.__version__
[2]:
'1.0b3.dev69+g3b5fa83.d20190322'
Initialization
Odhin requires a settings file in the YAML format. This file contain all the needed files (cube to process, catalog, HR images and band filters) and parameters.
[3]:
!pygmentize settings.yml
# The variables defined here are substitued in the file.
vars:
  muse_path: "data"
  hst_path: "data"

# Low Resolution data:
# the cube to deblend, and optionally its white-light image
cube: "{muse_path}/DATACUBE_UDF-10.fits"
white: "{muse_path}/IMAGE_UDF-10.fits"

# High Resolution data:
# segmentation map and associated catalog, list of images
segmap: "{hst_path}/segmentation_map_rafelski_2015.fits"
catalog: "{hst_path}/uvudf_rafelski_2015.fits"
hr_ref_band: "F606W"

# Definition of HR bands, for which we need the file, the filter, and
# for HST the calibration factor to convert pixel values in electrons/s
# to erg cm-2 s-1 Angstrom-1.
#
# http://www.stsci.edu/hst/acs/analysis/zeropoints
# https://acszeropoints.stsci.edu/results_all/?date=&detector=WFC
# There is also a Python API here:
# https://acstools.readthedocs.io/en/latest/acszpt.html
#
hr_bands:
  F606W:
    file: "{hst_path}/hlsp_xdf_hst_acswfc-30mas_hudf_f606w_v1_sci.fits"
    filter: "{hst_path}/HST_ACS_WFC.F606W_81.dat"
    photflam: 7.73e-20
  F775W:
    file: "{hst_path}/hlsp_xdf_hst_acswfc-30mas_hudf_f775w_v1_sci.fits"
    filter: "{hst_path}/HST_ACS_WFC.F775W_81.dat"
    photflam: 9.74e-20
  # F814W:
  #   file: "{hst_path}/hlsp_xdf_hst_acswfc-30mas_hudf_f814w_v1_sci.fits"
  #   filter: "{hst_path}/HST_ACS_WFC.F814W_81.dat"
  #   photflam: 7.05e-20
  # F850LP:
  #   file: "{hst_path}/hlsp_xdf_hst_acswfc-30mas_hudf_f850lp_v1_sci.fits"
  #   filter: "{hst_path}/HST_ACS_WFC.F850LP_81.dat"
  #   photflam: 1.50e-19

# kernel HR -> LR to be used for preprocessing (grouping).
# If none provided build transfer kernel from default parameters
# kernel_transfert:

# Parameters:
# This will override the default parameters.
params:
  filt_w: 151
[4]:
odhin.DEFAULT_PARAMS
[4]:
{'beta_hst': 1.6,
 'fwhm_hst': 0.085,
 'nBands': 10,
 'fsf_a_muse': 0.869,
 'fsf_b_muse': -3.401e-05,
 'fsf_beta_muse': 2.8,
 'fsf_wavelength': 7000,
 'cut': 0.005,
 'alpha_cut': 0.999,
 'regul': True,
 'filt_w': 101,
 'min_width': 6,
 'margin_bbox': 3,
 'min_sky_pixels': 20}
[5]:
# let's create the main object
outdir = 'groups'
debl = odhin.ODHIN('settings.yml', outdir)
WARNING found 12 sources in segmap that are missing in the catalog (ID: [ 6735 7028 7330 7553 8159 8857 9186 9292 9330 9744 9773 10074]), adding them to the catalog
During initialization Odhin found 12 sources in the segmap that are not listed in the catalog. So these sources were added to the catalog, with their ID from the segmentation map.
Grouping
[6]:
# create the partition of the data for multiprocessing
%time debl.grouping(cut=0.005, verbose=True)
WARNING found no sources in group 4

CPU times: user 1min 1s, sys: 2.93 s, total: 1min 4s
Wall time: 1min 3s
[7]:
# this creates a groups table
debl.table_groups[:15]
[7]:
Table length=15
| group_id | nb_sources | list_ids | area |
|---|---|---|---|
| int64 | int64 | object | float64 |
| 0 | 2 | ('bg', 22485) | 1.0 |
| 1 | 2 | ('bg', 4696) | 16.0 |
| 2 | 2 | ('bg', 22466) | 22.0 |
| 3 | 15 | ('bg', 4452, 6672, 6775, 10416, 22230, 22252, 22260, 22350, 22351, 22368, 22406, 22410, 25333, 25370) | 895.0 |
| 4 | 1 | ('bg',) | 10.0 |
| 5 | 2 | ('bg', 22434) | 126.0 |
| 6 | 16 | ('bg', 4433, 4554, 4581, 4582, 4596, 4663, 4883, 4999, 5074, 6456, 6490, 6508, 6541, 22287, 22289) | 731.0 |
| 7 | 2 | ('bg', 10505) | 6.0 |
| 8 | 11 | ('bg', 4506, 4507, 4575, 4619, 4646, 4657, 4677, 4684, 4703, 10450) | 339.0 |
| 9 | 7 | ('bg', 4662, 4675, 4676, 10472, 10475, 10479) | 153.0 |
| 10 | 18 | ('bg', 4457, 4508, 4540, 4541, 4557, 6434, 6450, 6569, 6576, 6577, 6604, 10448, 22386, 22429, 22431, 22432, 22451) | 481.0 |
| 11 | 2 | ('bg', 4671) | 25.0 |
| 12 | 3 | ('bg', 4607, 4659) | 64.0 |
| 13 | 10 | ('bg', 4451, 4460, 4465, 4498, 4564, 4569, 4587, 4615, 4669) | 277.0 |
| 14 | 3 | ('bg', 4644, 4661) | 23.0 |
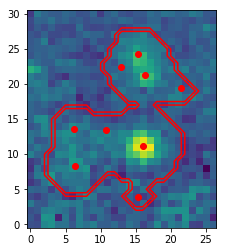
[8]:
debl.plotAGroup(group_id=13)
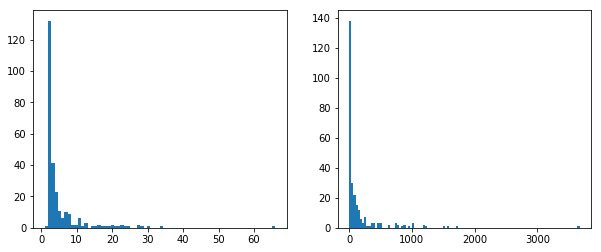
[9]:
# show histogram of nb of sources
fig, (ax1, ax2) = plt.subplots(1, 2, figsize=(10, 4))
debl.plotHistNbS(ax=ax1)
debl.plotHistArea(ax=ax2)
Deblending
[10]:
!rm -rf groups/
[11]:
debl.set_loglevel('DEBUG')
[12]:
# do the deblending for a given group
%time debl.deblend(listGroupToDeblend=[13])
DEBUG using 1 cpus
DEBUG group 13, start, 10 sources
DEBUG group 13, createIntensityMap
DEBUG group 13, findSources
DEBUG group 13, write
DEBUG group 13, done
CPU times: user 23.8 s, sys: 8.45 s, total: 32.2 s
Wall time: 22.3 s
[13]:
debl.set_loglevel('INFO')
[14]:
# deblending can be run on parallel
%time debl.deblend(listGroupToDeblend=[1, 2], njobs=2)
CPU times: user 569 ms, sys: 39.5 ms, total: 609 ms
Wall time: 6.26 s
[15]:
debl.table_sources
[15]:
Table masked=True length=14
| id | group_id | xi2 | group_area | nb_sources | condition_number | xi2_group | ra | dec |
|---|---|---|---|---|---|---|---|---|
| degrees | degrees | |||||||
| str5 | int64 | float64 | int64 | int64 | float64 | float64 | float64 | float64 |
| 4696 | 1 | 0.4260967446973673 | 16 | 2 | 1.0 | 0.4288691580373501 | 53.1690232 | -27.78761749 |
| bg_1 | 1 | 0.4288691580373501 | 16 | 2 | 1.0 | 0.4288691580373501 | -- | -- |
| 22466 | 2 | 0.4387081578865029 | 22 | 2 | 1.0 | 0.43881575750397445 | 53.16727858 | -27.78753407 |
| bg_2 | 2 | 0.43881575750397445 | 22 | 2 | 1.0 | 0.43881575750397445 | -- | -- |
| 4451 | 13 | 0.40966608763232765 | 277 | 10 | 1.8136376768205238 | 0.4283730926980553 | 53.16937544 | -27.78630885 |
| 4460 | 13 | 0.41352676997178595 | 277 | 10 | 1.8136376768205238 | 0.4283730926980553 | 53.16952435 | -27.78641212 |
| 4465 | 13 | 0.4110619896856303 | 277 | 10 | 1.8136376768205238 | 0.4283730926980553 | 53.16930873 | -27.78647426 |
| 4498 | 13 | 0.40874925975702725 | 277 | 10 | 1.8136376768205238 | 0.4283730926980553 | 53.16899169 | -27.78657868 |
| 4564 | 13 | 0.43634222770478426 | 277 | 10 | 1.8136376768205238 | 0.4283730926980553 | 53.1699427 | -27.78690151 |
| 4569 | 13 | 0.4318966930742678 | 277 | 10 | 1.8136376768205238 | 0.4283730926980553 | 53.16965972 | -27.78691025 |
| 4587 | 13 | 0.4332917569889128 | 277 | 10 | 1.8136376768205238 | 0.4283730926980553 | 53.16933333 | -27.78703805 |
| 4615 | 13 | 0.45062548028917815 | 277 | 10 | 1.8136376768205238 | 0.4283730926980553 | 53.16993487 | -27.78719565 |
| 4669 | 13 | 0.4444728911888013 | 277 | 10 | 1.8136376768205238 | 0.4283730926980553 | 53.16937712 | -27.78744148 |
| bg_13 | 13 | 0.4283730926980543 | 277 | 10 | 1.8136376768205238 | 0.4283730926980553 | -- | -- |
[16]:
debl.table_sources.write(f'{outdir}/catalog.fits')
WARNING: UnitsWarning: 'degrees' did not parse as fits unit: At col 0, Unit 'degrees' not supported by the FITS standard. [astropy.units.core]
WARNING UnitsWarning: 'degrees' did not parse as fits unit: At col 0, Unit 'degrees' not supported by the FITS standard.
Result files
For each group, a Source file is produced.
[17]:
ls groups/
catalog.fits group_00001.fits group_00002.fits group_00013.fits
[18]:
from mpdaf.sdetect import Source

src = Source.from_file('groups/group_00013.fits')
src.info()
INFO ID      =                   13 / object ID %d
INFO RA      =    53.16950198918362 / RA u.degree %.7f
INFO DEC     =   -27.78686655097766 / DEC u.degree %.7f
INFO FROM    = 'Odhin   '           / detection software
INFO FROM_V  = '1.0b3.dev69+g3b5fa83.d20190322' / version of the detection software
INFO CUBE    = 'DATACUBE_UDF-10.fits' / datacube
INFO CUBE_V  = '1.0b1   '           / version of the datacube
INFO SRC_V   = ''
INFO GRP_ID  =                   13
INFO GRP_AREA=                  277
INFO GRP_NSRC=                   10
INFO COND_NB =    1.813637676820524
INFO XI2_TOT =   0.4283730926980553
INFO FORMAT  = '0.6     '           / Version of the Source format
INFO COMMENT
INFO COMMENT ODHIN PARAMETERS:
INFO COMMENT
INFO COMMENT catalog: data/uvudf_rafelski_2015.fits
INFO COMMENT cube: data/DATACUBE_UDF-10.fits
INFO COMMENT hr_bands:
INFO COMMENT   F606W:
INFO COMMENT     file: data/hlsp_xdf_hst_acswfc-30mas_hudf_f606w_v1_sci.fits
INFO COMMENT     filter: data/HST_ACS_WFC.F606W_81.dat
INFO COMMENT     photflam: 7.73e-20
INFO COMMENT   F775W:
INFO COMMENT     file: data/hlsp_xdf_hst_acswfc-30mas_hudf_f775w_v1_sci.fits
INFO COMMENT     filter: data/HST_ACS_WFC.F775W_81.dat
INFO COMMENT     photflam: 9.74e-20
INFO COMMENT hr_ref_band: F606W
INFO COMMENT params:
INFO COMMENT   filt_w: 151
INFO COMMENT segmap: data/segmentation_map_rafelski_2015.fits
INFO COMMENT vars:
INFO COMMENT   hst_path: data
INFO COMMENT   muse_path: data
INFO COMMENT white: data/IMAGE_UDF-10.fits
INFO 10 spectra: BG 4451 4460 4465 4498 4564 4569 4587 4615 4669
INFO 2 images: MUSE_WHITE FITTED
INFO 2 cubes: MUSE FITTED
INFO 1 tables: SOURCES
[19]:
src.images, src.spectra
[19]:
(2 images: MUSE_WHITE FITTED,
 10 spectra: BG 4451 4460 4465 4498 4564 4569 4587 4615 4669)
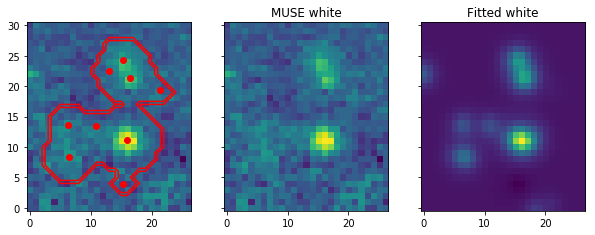
[20]:
fig, (ax1, ax2, ax3) = plt.subplots(1, 3, figsize=(10, 4), sharex=True, sharey=True)
debl.plotAGroup(ax=ax1, group_id=13)
src.images['MUSE_WHITE'].plot(ax=ax2, title='MUSE white')
src.images['FITTED'].plot(ax=ax3, title='Fitted white');
[21]:
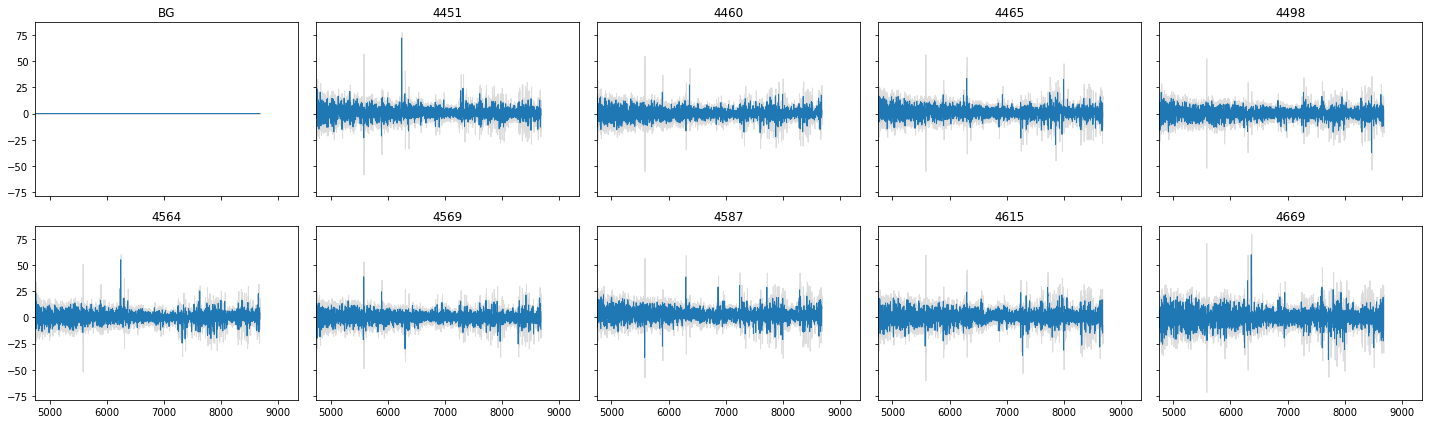
fig, axes = plt.subplots(2, 5, figsize=(5*4, 2*3), sharex=True, sharey=True)
for i, name in enumerate(src.spectra):
    ax = axes.flat[i]
    src.spectra[name].plot(noise=True, ax=ax, title=name)
    ax.set_xlabel('')
fig.tight_layout()